Scales
Horizontal and vertical scales can be set for Bar, Area and Line Charts. You may define them both or just one of them.
Scales have the following properties:
- template – a template for scale labels (isn't necessary for the vertical scale),
- title – a scale title,
- lines – a boolean value (true or false), that defines if scale lines need being drawn.
'Vertical Bar' and Line Charts personality.
- origin - a scale origin (value type is integer)
Each mark of the horizontal scale (xAxis property) corresponds to one data object.
The vertical scale (yAxis property) sets the top and bottom limits for displayed values. The marks of the scale are defined in scale configuration by the three properties:
- end – a top value of the scale,
- start – a bottom value,
- step – a scale unit.
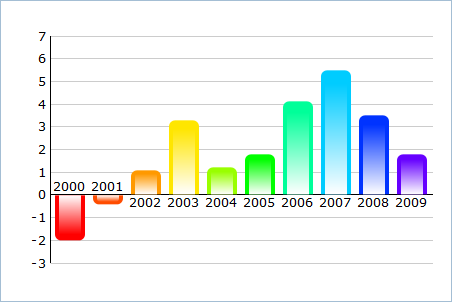
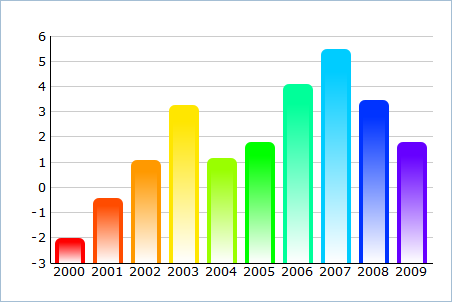
If these properties are not set, they will be automatically calculated. However, you may control the minimum value of a scale using the “origin” property of a chart. For example, if you've set origin:0, the scale will start from 0 value, even if the minimum value in dataset is greater.
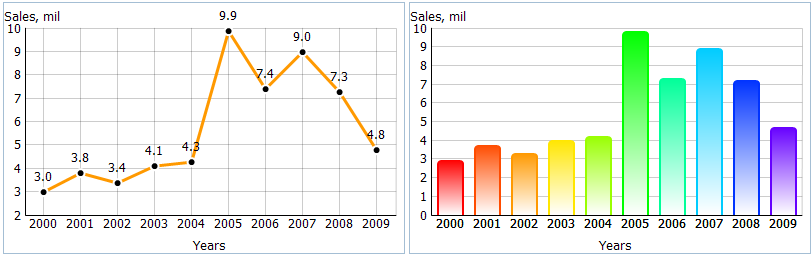
The vertical scale also requires the same properties as the horizontal scale: template, title and lines.
var chart =  new dhtmlXChart({
	…
        xAxis:{
		title: "Years",
		template: "#year#",
                lines: true
	},
	yAxis:{
		start:-10,
		end:10,
		step:2,
		title:"Sales,mil"
	},
        origin:0

})

var data = [
   { sales:"3.0", year:"2000" },
   { sales:"3.8", year:"2001" },
    ...
   { sales:"4.8", year:"2009" }
];
chart.parse(data,"json");