Pie Chart
A Pie Chart is a circular chart divided into sectors, illustrating relative magnitudes or frequencies. The arc length of each sector is proportional to the quantity it represents. Together, the sectors create a full disk.
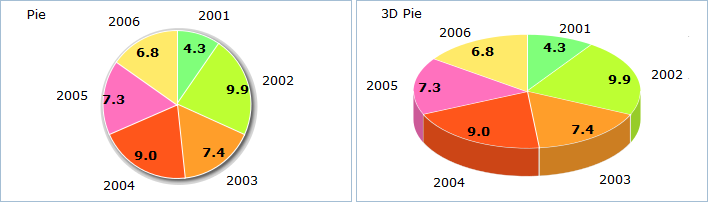
DHTMLX offers these sub-types of Pie Chart:
- Pie
- 3D Pie
Let’s start to create a Pie Chart yourself step by step. You will have possibillity to improve it by adding additional functions and propeties.
In the beginning, make some preparatory steps.
1. Select data of any avaliable format to present in your chart. In our examples we use Sales Information of one little company in json format.
var data = [
   { sales:"4.3", year:"2001" ,color:"#80ff7a"},
   { sales:"9.9", year:"2002" ,color:"#bdff33"},
   { sales:"7.4", year:"2003" ,color:"#ff9e2a"},
   { sales:"9.0", year:"2004" ,color:"#ff561b"},
   { sales:"7.3", year:"2005" ,color:"#ff71be"},
   { sales:"6.8", year:"2006" ,color:"#ffea69"}
];
2. Insert an HTML container to your page for your future chart. For example use the name “chart_container”.
<div id=" chart_container" style="width:450px;height:300px;border:1px solid #A4BED4;"></div>
Now, we need to fill in an object constructor. Let's go to know the details.
3. Set chart type depending on the sub-type you have chosen.
Pie - “pie”,
3D Pie - “pie3D”
We will create Pie, so in the property 'view' we'll specify the value “pie”.
var pieChart =  new dhtmlXChart({
		view:"pie"
		....
})
4. Define 'chart_container' in the ‘container’ property to set a chart container.
var pieChart =  new dhtmlXChart({
                view:"pie",
		container:"chart_container"
		...
})
5. Assign '#sales#' to the ‘value’ property to set data that Pie Chart will present.
var pieChart =  new dhtmlXChart({
		view: "pie",
                container: "chart_container",
                value: "#sales#"
		...
})
6. Set a pie color. In our example the colors of sectors are specified in data structure by “color” field. Know more about chart color here.
var pieChart =  new dhtmlXChart({
		view: "pie",
                container: "chart_container",
                value: "#sales#",
                color: "#color#"

		...
})
7. Add legend block definition (parameter 'legend') to your constructor with the following parameters: 'width','align', 'valign', 'marker', 'template'.
- Set legend block width. e.g. value '65'.
- Choose horizontal alignment for the legend block: “left”, “right” or “center”. We will apply right horizontal alignment.
- Choose vertical alignment: “top”, “bottom” or “middle”. We selected value 'top'.
- Define how coloured markers in legend block will look. In the example we will use the values:'#round#' as marker type and '15' as marker width.
- Specify a template for legend text e.g. value '#year#'.
var pieChart =  new dhtmlXChart({
		view:"pie",
		container:"chart_container",
	        value:"#sales#",
                color: "#color#",
                legend:{
	             width: 65,
	             align: "right",
	             valign: "top",
	             marker:{
      	                 type: "round",
	                 width: 15
                     },
                     template: "#year#"
                }
		...
})
8. Set inner pie labels (parameter 'pieInnerText') e.g. value '<b>#sales#</b>'.
var pieChart =  new dhtmlXChart({
		view:"pie",
		container:"chart_container",
	        value:"#sales#",
                color: "#color#",
                legend:{
	             width: 65,
	             align: "right",
	             valign: "top",
	             marker:{
      	                 type: "round",
	                 width: 15
	             },
                     template: "#year#"
                },
		pieInnerText:"<b>#sales#</b>"
})
9. Use method parse() to process data.
pieChart.parse(data,"json");
We've finished. Just run the application to see your creation.
Examples for each sub-type you can see here.